Monthly Sales Analysis Worksheet
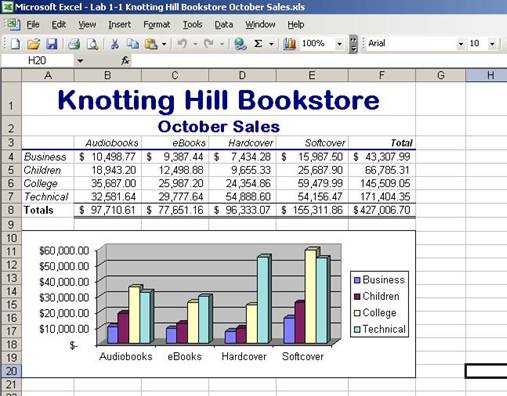
You work part-time as a spreadsheet specialist for Knotting Hill Bookstore, one of the larger bookstores in the world. Your manager has asked you to develop a monthly sales analysis worksheet similar to the one shown in Figure 1
Instructions: Perform the following tasks.
1. Create the worksheet shown in Figure 1 using the sales amounts and categories in Table 1 below.
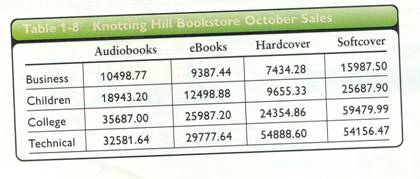
2. Use the SUM function to determine the totals for the types of books, subject area, and company totals,:
3. Format the worksheet title to 26-point Arial Rounded MT Bold dark blue, bold font and center it across columns A through F. Do not be concerned if the edges of the worksheet title are not displayed.
4. Format the worksheet subtitle to 16-point Arial Rounded MT Bold dark blue, bold font and center it columns A through F.
5. Format the range A3:F8 using the AutoFormat command. Select the Accounting 1 autoformat.
6. Select the range A3:E7 and then use the Chart Wizard button on the Standard toolbar to draw a column with a 3-D visual effect chart (column 1, row 2 in the Chart sub-type list). Move and resize the chart so that it appears in the range A10:F20. If the labels along the horizontal axis (x-axis) do not appear as shown in Figure 1, then drag the right side of the chart so that it is displayed in the range At 10:H20.
7. Enter your name, course, laboratory assignment number, date, and instructor name in cells A22 through A26.
8. Save the workbook to your Excel/Project 1 folder using the file name Lab 1-1 Knotting Hill Bookstore October Sales.